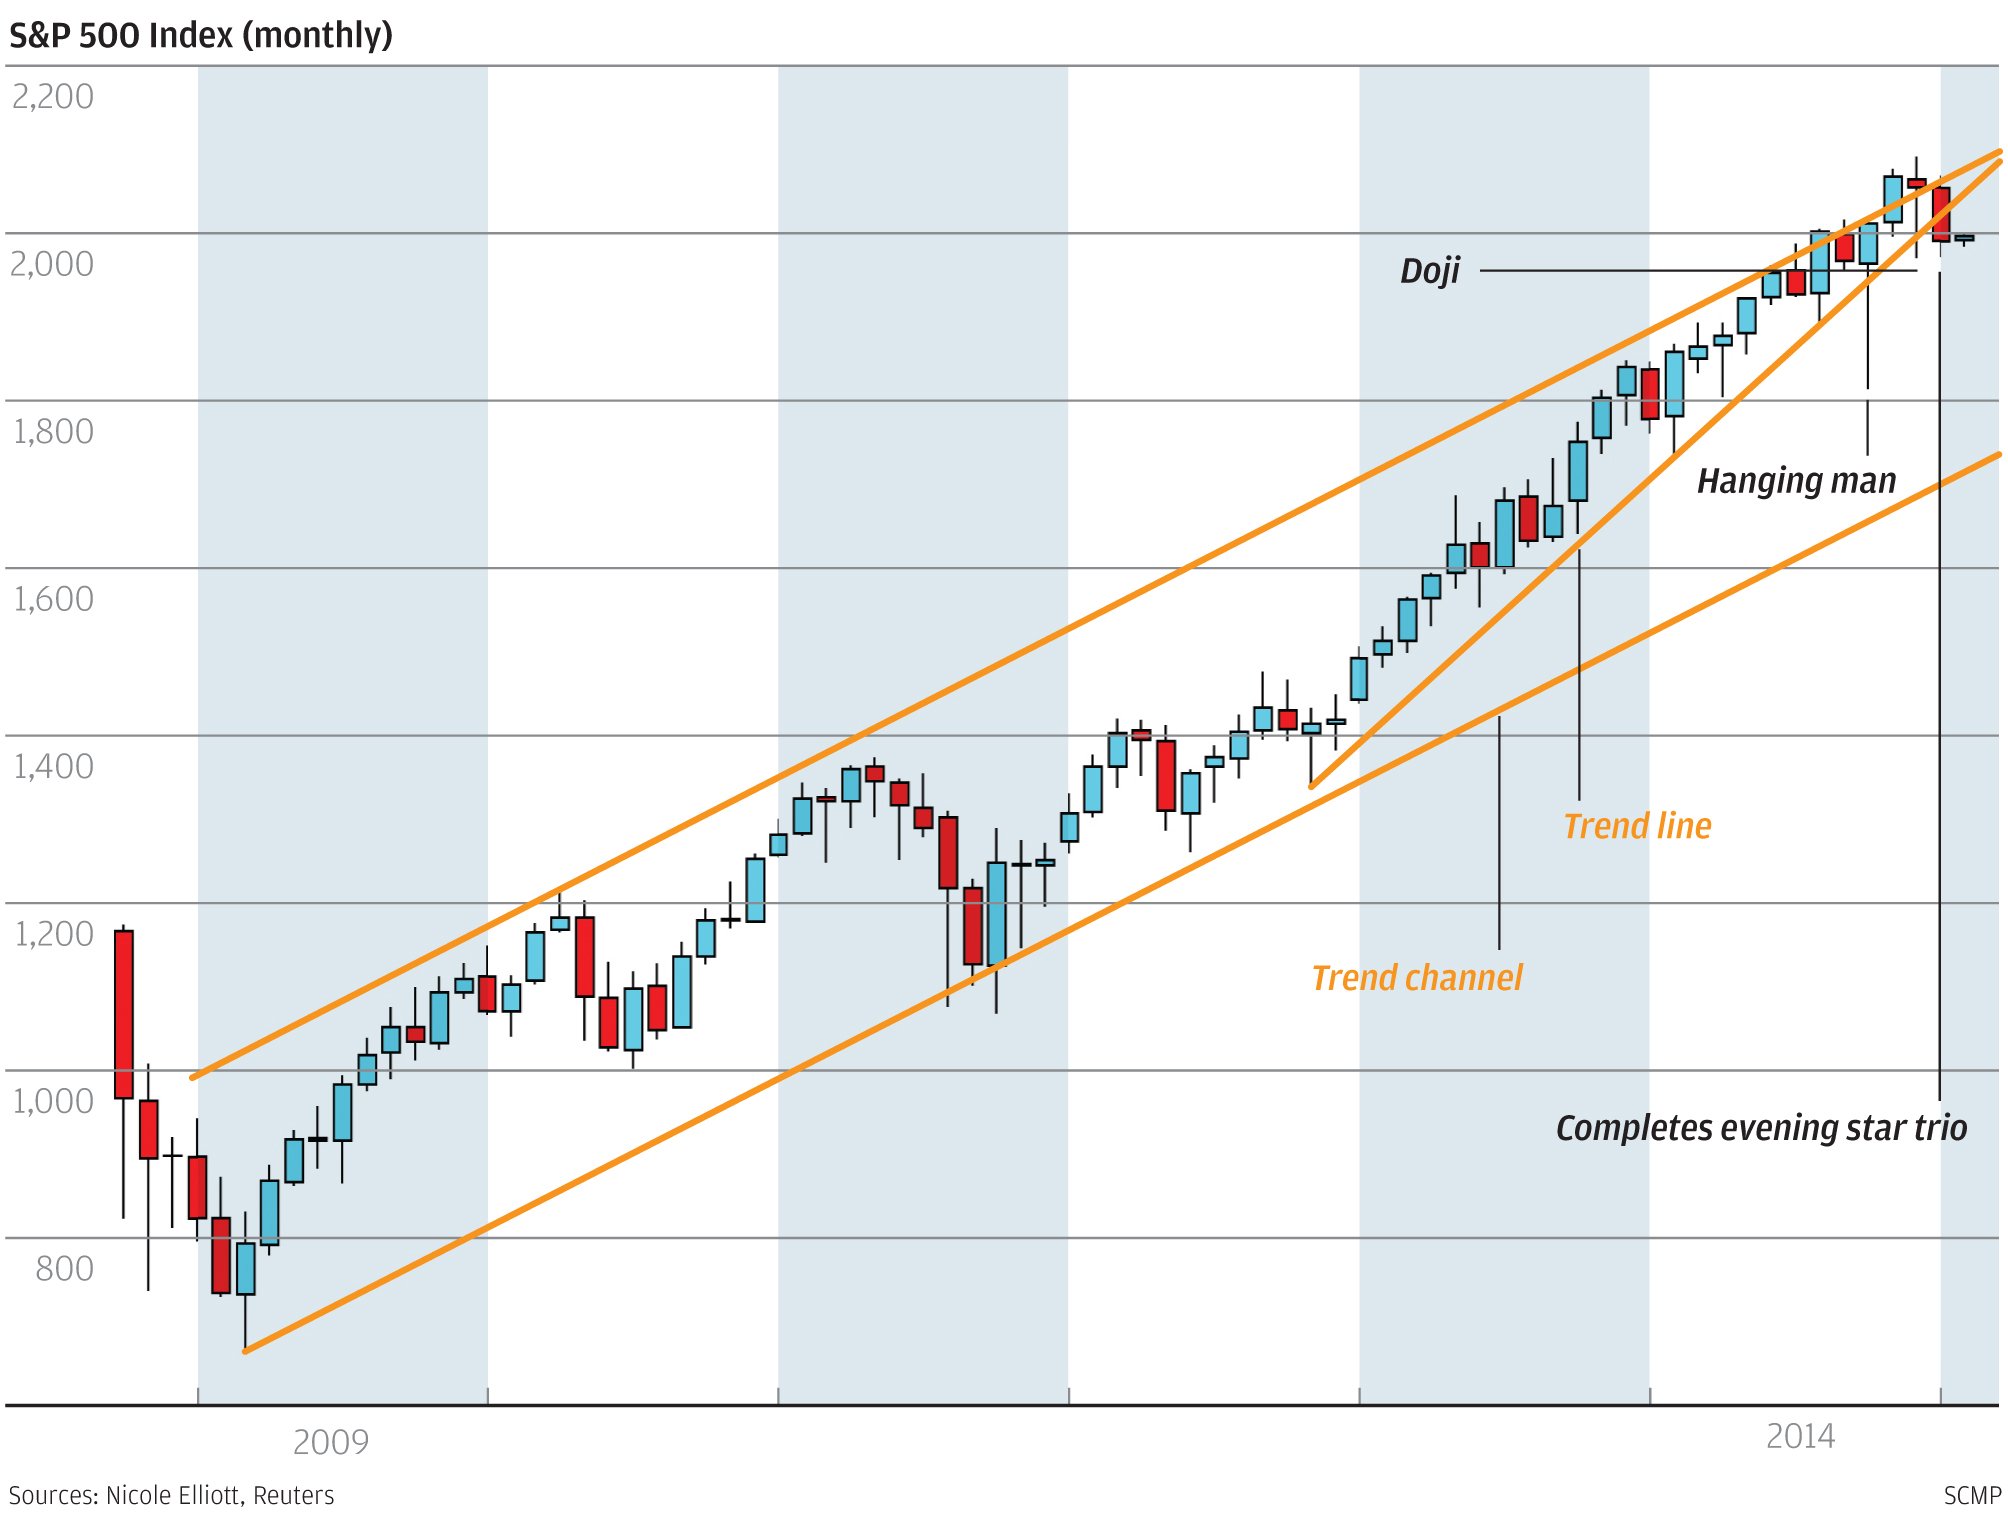
After January's shock start to the year for the S&P 500 Index, let's take a step back. Although the benchmark ended in positive territory from January 2014, it struggled in the second half of last year. Monthly candlesticks have been banging up against the top of the trend channel that has dominated since 2009 - including a massive bearish hanging man in October. Last month's red candle, with the lowest monthly close since September and below trend line support, completes an evening star three-candle combination, at its centre December's doji denoting indecision. This hints at a correction in the first half of this year, suggesting a drop to the bottom of the trend channel.